An estimate and its uncertainty
Compare a point estimate with the uncertainty around it.
The picture in words
- Point estimates
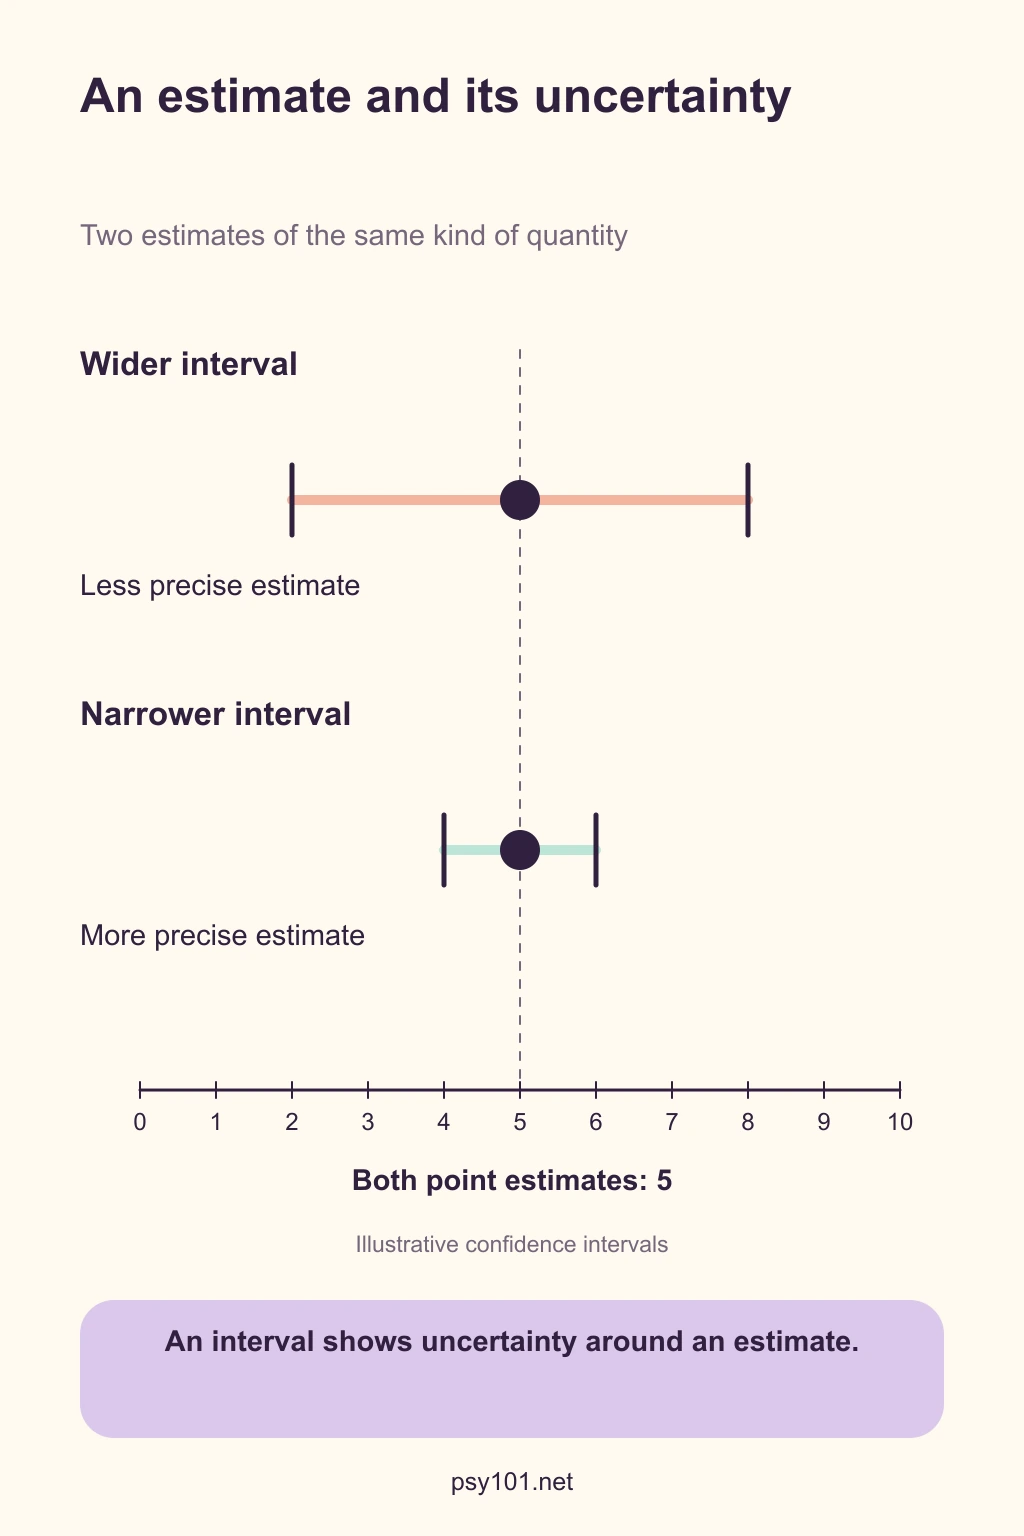
- Both point estimates are 5, on a shared scale from 0 to 10.
- Wider interval
- The illustrative interval extends from 2 to 8.
- Narrower interval
- The illustrative interval extends from 4 to 6.
- Precision
- At the same confidence level, the narrower interval represents a more precise estimate.
- Confidence level
- Coverage describes repeated use of the estimation procedure.
Reading the illustration
The intervals are illustrative. With the same confidence level, a narrower interval indicates a more precise estimate.
Try a question
What does a 95% confidence level describe?
Show the explanation
Across repeated samples under the method’s assumptions, about 95% of intervals constructed by that procedure would cover the fixed population quantity.
Read the sources
- U.S. Census Bureau. (2021, October 8). A basic explanation of confidence intervals. https://www.census.gov/programs-surveys/saipe/guidance/confidence-intervals.htmlSelected rendered explanation of interval estimates and repeated-sampling coverage.