How large is the difference?
Read the magnitude of a group difference on a common scale.
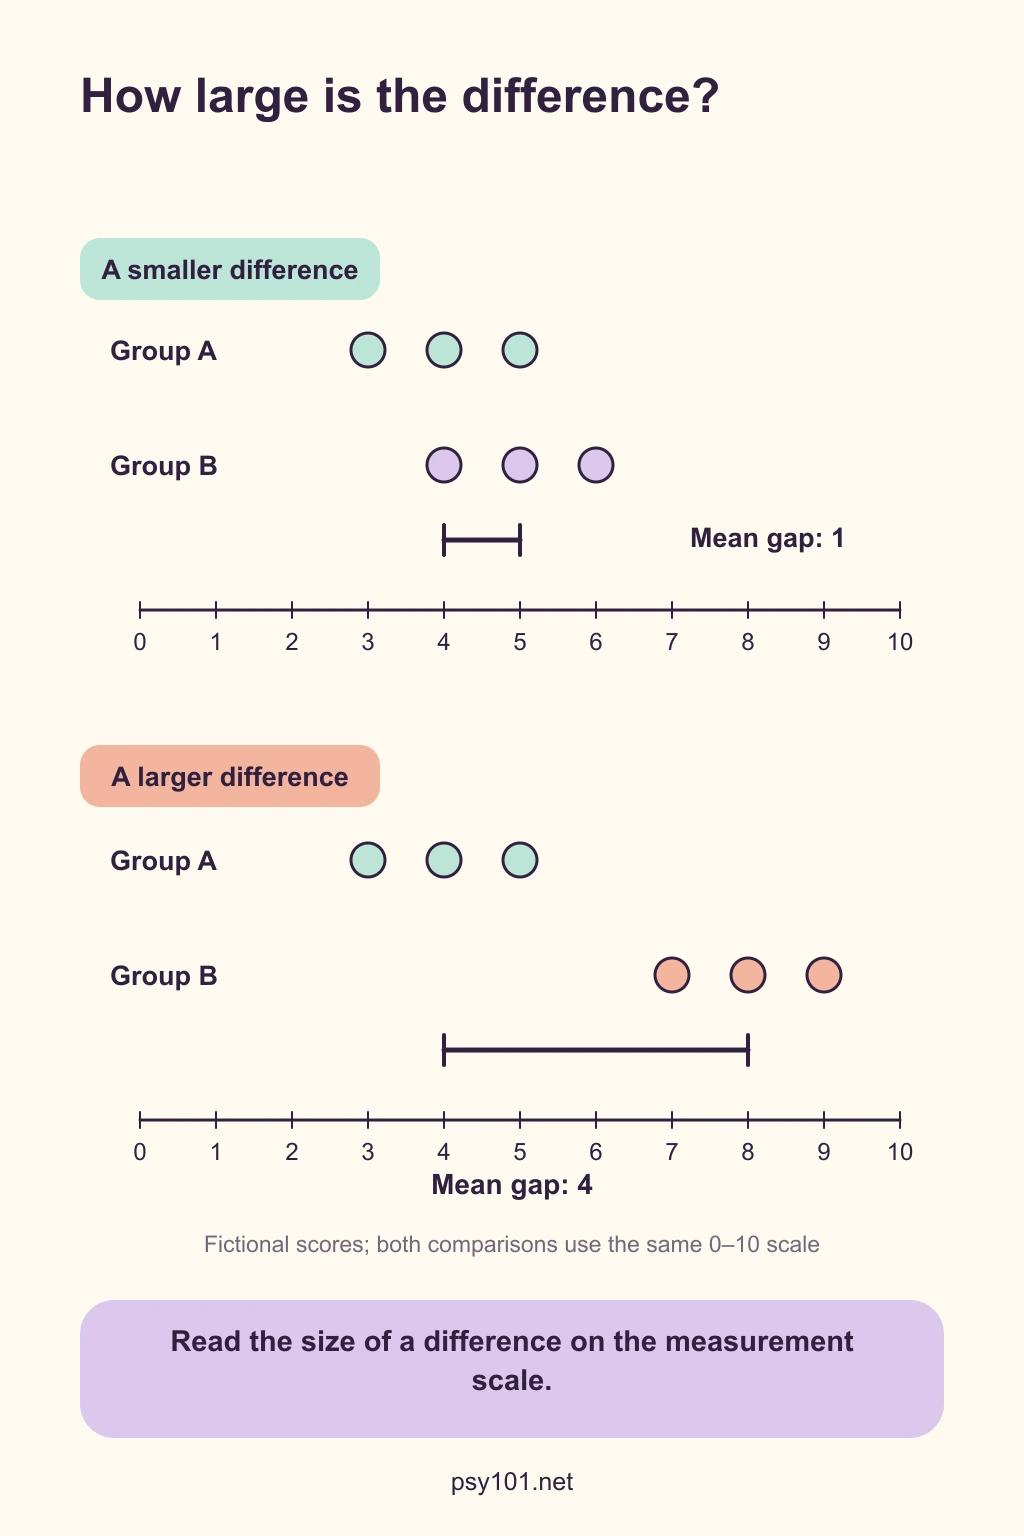
The picture in words
- Shared scale
- Both comparisons use the same fictional measurement scale, from 0 to 10.
- Smaller difference
- Group A: 3, 4 and 5, with mean 4. Group B: 4, 5 and 6, with mean 5. The mean gap is 1.
- Larger difference
- Group A: 3, 4 and 5, with mean 4. Group B: 7, 8 and 9, with mean 8. The mean gap is 4.
- Interpretation
- Compare the gap in the measurement units and consider the research question.
Reading the illustration
Compare the distances between means while keeping the individual observations in view. The values are illustrative.
Try a question
Why keep the same measurement scale in both comparisons?
Show the explanation
It makes the gaps directly comparable. The size of a gap can otherwise be distorted by changing the axis.
Read the sources
- American Statistical Association. (2016, March 7). American Statistical Association releases statement on statistical significance and p-values [Press release]. https://www.amstat.org/asa/files/pdfs/p-valuestatement.pdfSelected PDF passages on effect magnitude and practical importance, reviewed in the topic-selection research.