The same average, different spread
Compare the variability hidden behind an average.
The picture in words
- Shared scale
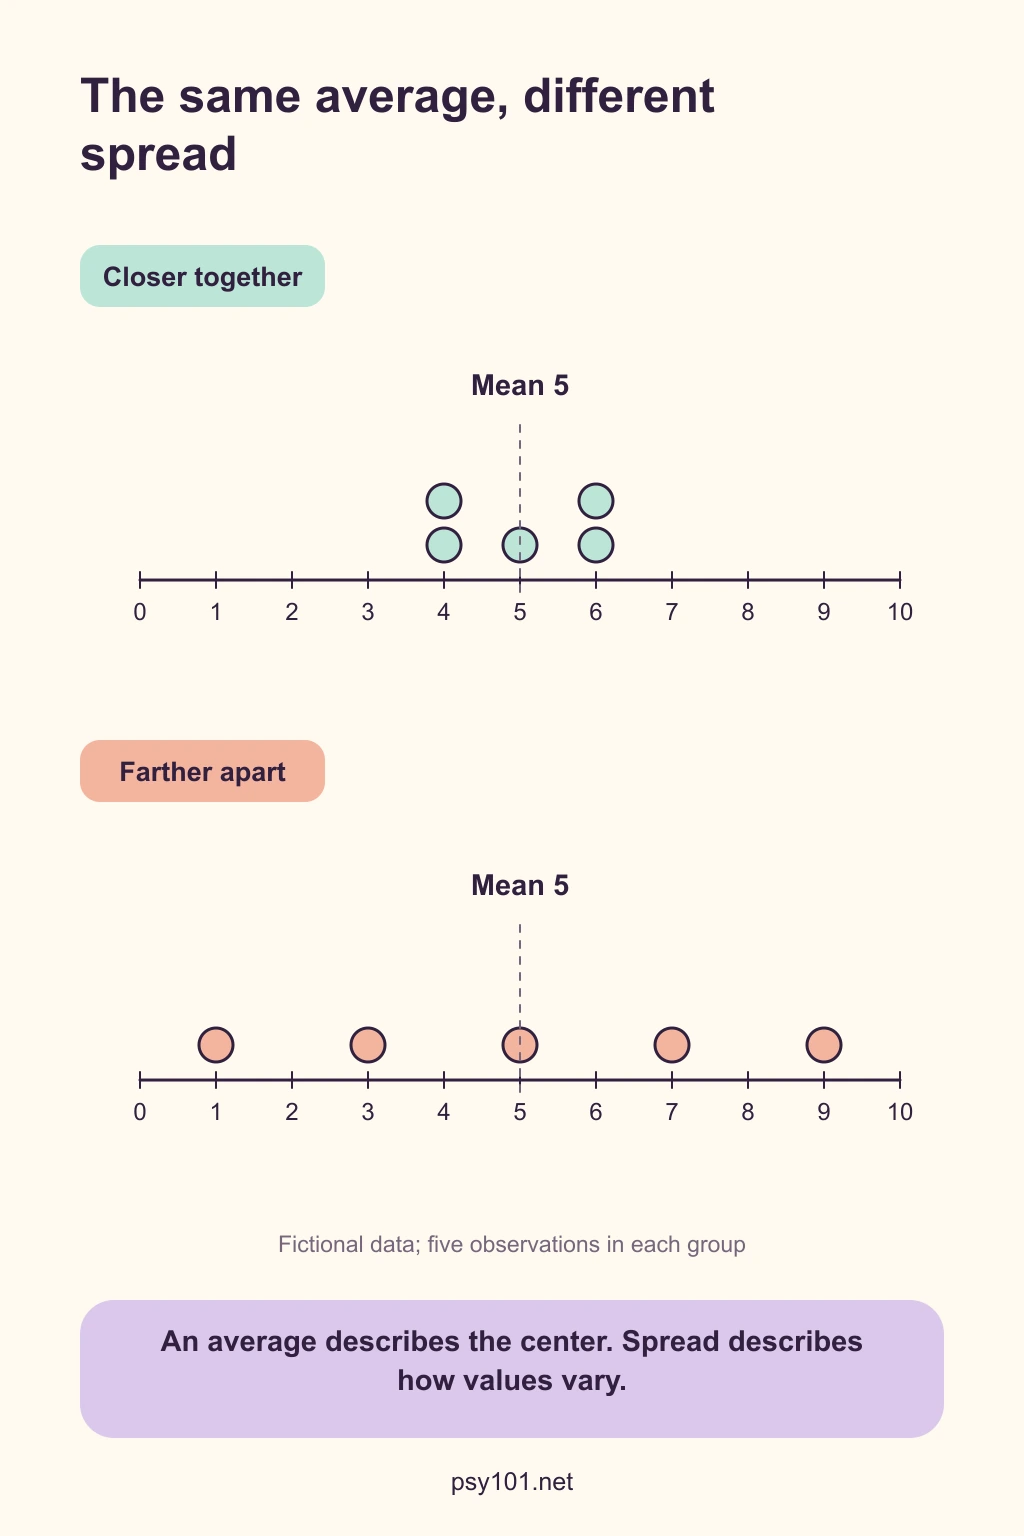
- Both plots use the same scale, from 0 to 10.
- Closer together
- The five values are 4, 4, 5, 6 and 6. Their mean is 5.
- Farther apart
- The five values are 1, 3, 5, 7 and 9. Their mean is also 5.
- Comparison
- The means match while the second set is more spread out.
Reading the illustration
Use the shared scale to compare how far values lie from the center. The data are constructed for teaching.
Try a question
What information would be lost if you reported only the mean?
Show the explanation
You would miss how tightly clustered or widely dispersed the observations are.
Read the sources
- Illowsky, B., & Dean, S. (2023). Introductory statistics 2e. OpenStax. https://openstax.org/books/introductory-statistics-2e/pages/2-7-measures-of-the-spread-of-the-dataSelected rendered explanations and tables on variability, reviewed in the topic-selection research.